Designing Pack Price Architecture (PPA) through Conjoint
Part 3/3 from Jayant - insightful piece on Price Pack Architecture to optimise portfolios. From whatever I've seen, this is one of the most effective parts of the Revenue Growth toolkit.
Designing Pack Price
Architecture (PPA) through Conjoint
Most consumer decisions are made
within the influence of several factors – price, competitive marketing efforts
(media and trade promotions), brand significance, share of mind/shelf in the shop/retail,
new innovative launches etc. So how can a researcher decide on a methodology
that allows us to study the impact of these variables when optimizing a brand
portfolio.
Price Pack Architecture is
important to ensure that each SKU in a brand portfolio is aiding in maximizing
volume and value for the parent brand (with least cannibalization). Since each
SKU would differ slightly in its offering (size, price, flavor etc.), it needs
to be understood what impact does it have on the business by changing or
introducing new SKUs or brands in the portfolio.
Conjoint is one of the most commonly used research tools to
study the impact of different PPA scenarios, e.g.
·
what would happen if we change the size (grams)
of one of our SKUs?
·
Does a 10-cookie pack cannibalize my own 5
cookie pack or take from competition?
·
Does reducing price by $1 hep increase volumes
enough to bring more revenue?
How it
works?
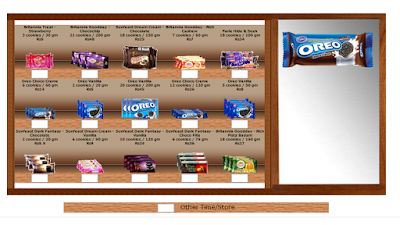
Collecting data – The exercise is simple – each respondent is shown
a series of scenarios with different brands and SKUs at different price points.
These SKUs and price points vary for each scenario. We may show some brands and
SKUs in some screen and not show in another. The same SKU can have a variation
of price points (generally defined as +10% or +5% of base price).
Then for each scenario the
respondent is asked to choose an option they would most likely buy (assuming
this were a real purchase). To make the scenario true to reality we sometimes
also offer an option of “none/buy something else” to allow the respondent an
option to reject all options in a scenario. Below is a screen to illustrate a
survey screen. Generally, a respondent is exposed to 10-15 such screens
depending on the number of brands/SKUs we are testing.
Interpreting the output –
•
Price sensitivity analysis is done to determine Optimal
price points: Below is an example of a price sensitivity analysis – it shows
that if everything in the market were to remain constant, how would our brands
value and volume sales change if we alter the price. The slope of this curve is
called price elasticity (i.e. the change in value/volume sales if we change the
price by 1 unit). Brand managers desire to have price in-elastic products (i.e.
very small price elasticity ~0). A low-price elasticity would indicate that the
brand doesn’t lose sales as we increase price.
The price range to play in would be the
region between two break points i.e. the points where there is a biggest drop
in sales when price is changed
•
Forecasting volumes in different scenarios – we
can create scenarios and predict the volume/value sales changes. E.g. look at
the example below –
•
The portfolio mix with an addition of small pack
(4 cookie) in Choco Crème leads to an overall 6% and 4% growth in volume and
revenue respectively of the portfolio
•
However, this portfolio mix leads to 7% decrease
in both volume and revenue respectively for the Vanilla variants
Running
different permutation and combination of such scenarios will then help estimate
gain/loss to portfolio, thus deciding an optimal portfolio. We can also
create scenarios where the competition prices and launches can be presumed to
predict different “what if” scenarios.


Comments
Post a Comment